
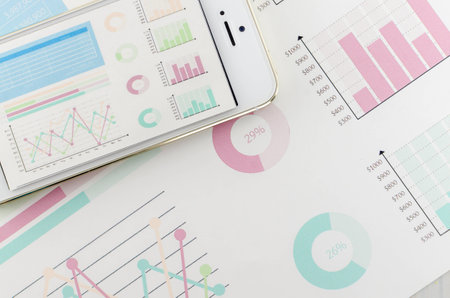
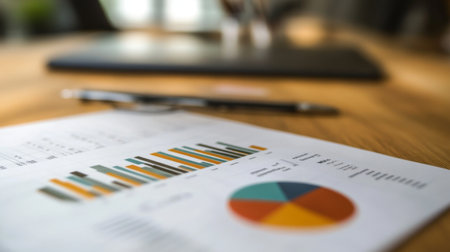
Stock market business graph chart on digital screen
Коллекция по умолчанию
Коллекция по умолчанию
Создать новую

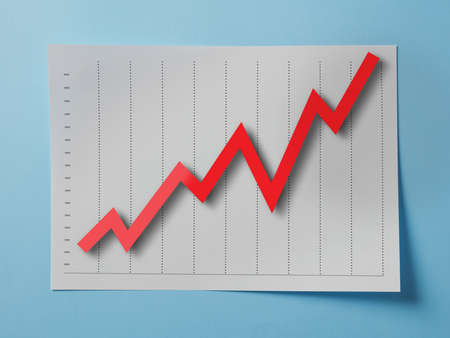
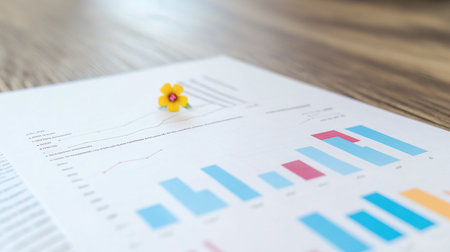
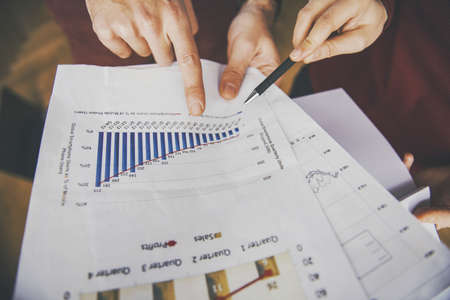
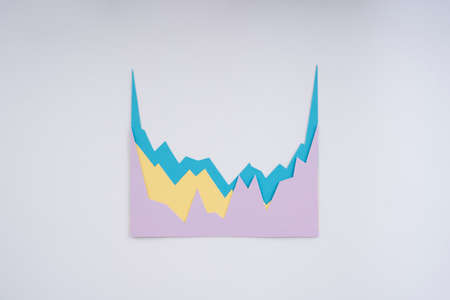
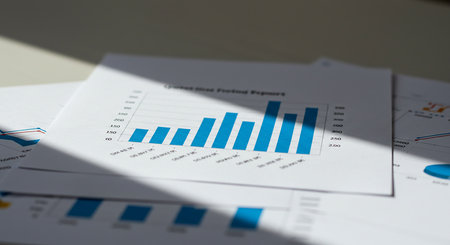
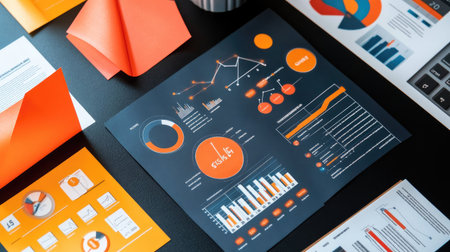
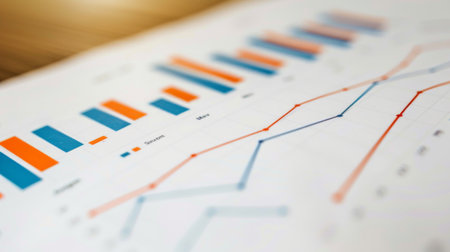
Statistical financial graph predicting an economic depression after a 2020 global coronavirus pandemic.
Коллекция по умолчанию
Коллекция по умолчанию
Создать новую

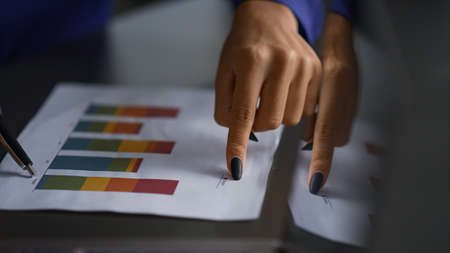
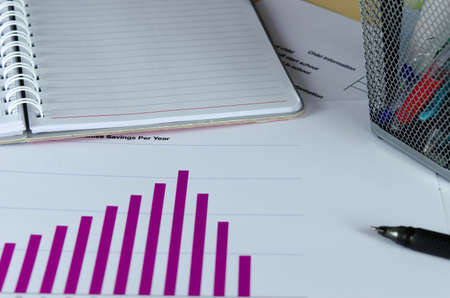
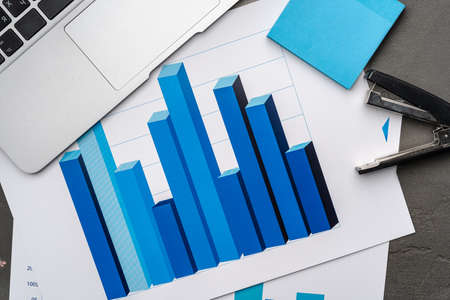
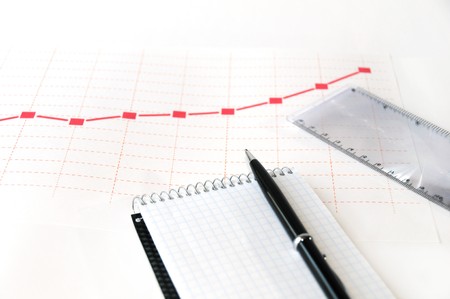
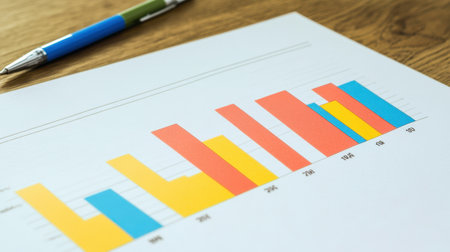
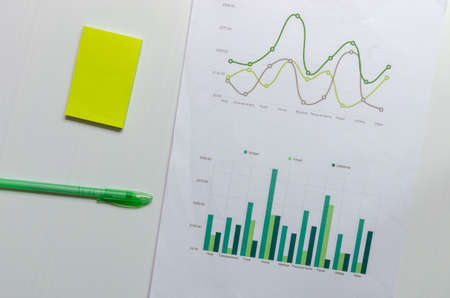
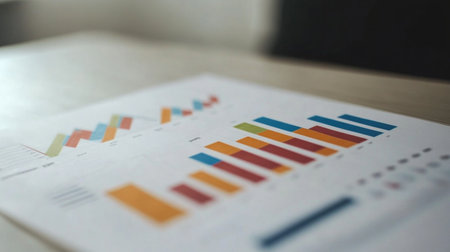
Colored sticker stripes on business analytics chart closeup
Коллекция по умолчанию
Коллекция по умолчанию
Создать новую
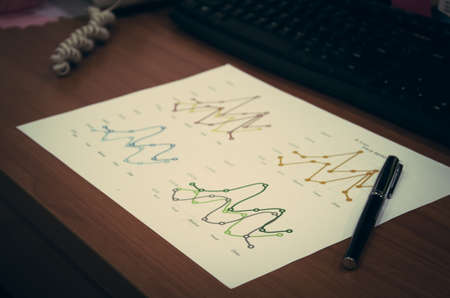
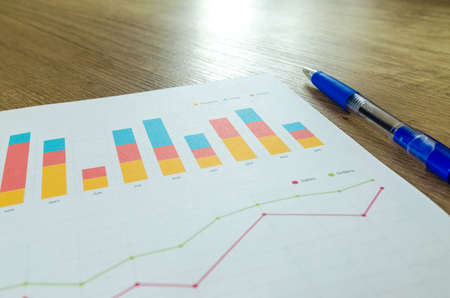
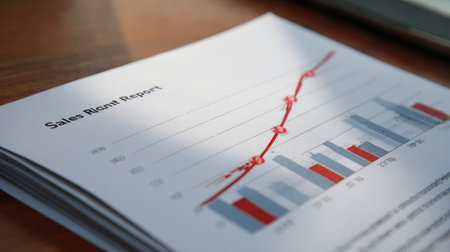
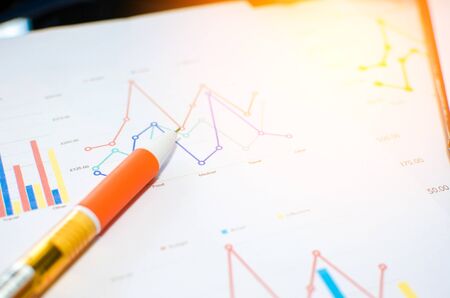
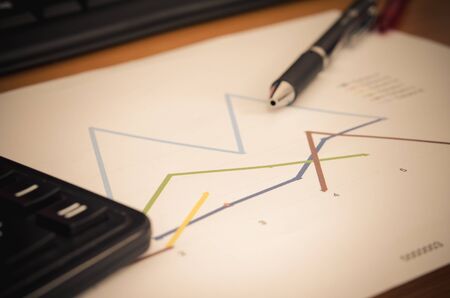
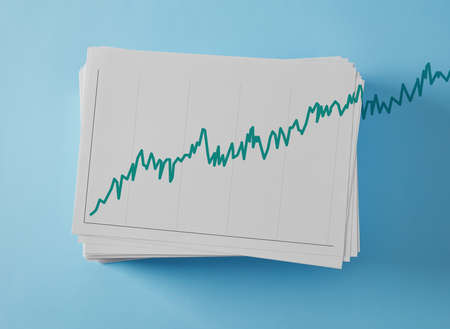
Line graph on desk and pen. Vintage filter
Коллекция по умолчанию
Коллекция по умолчанию
Создать новую

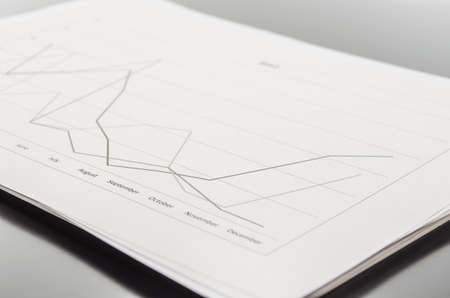
Graph of market share with black pen in business concept
Коллекция по умолчанию
Коллекция по умолчанию
Создать новую

ballpoint pen indicates income graphs lying on the table
Коллекция по умолчанию
Коллекция по умолчанию
Создать новую
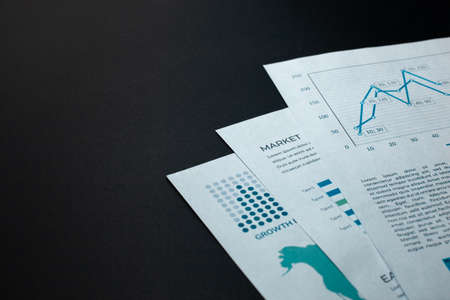
Graph document on a black table
Коллекция по умолчанию
Коллекция по умолчанию
Создать новую

Businessmen miniature figure standing on investment and profit graph for analysis and discussion.
Коллекция по умолчанию
Коллекция по умолчанию
Создать новую

Radiated emissions spectrogram with limit lines in EMC electromagnetic compatibility test report
Коллекция по умолчанию
Коллекция по умолчанию
Создать новую
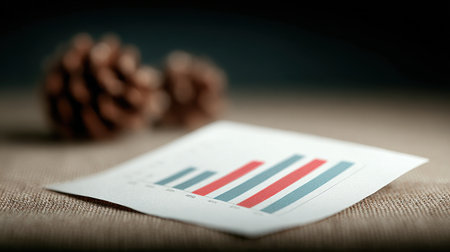
A piece of paper with a graph on it is on a table. The graph is a bar chart with a red and blue line. The paper is crumpled and has a few creases
Коллекция по умолчанию
Коллекция по умолчанию
Создать новую
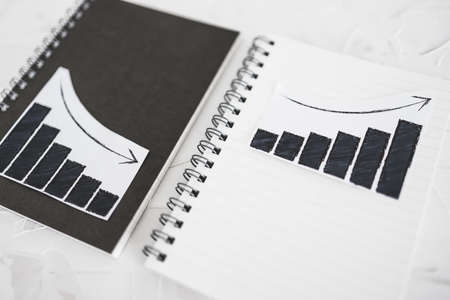
business analysis and statistics concept, positive and negative trends on graphs on notebooks side by side
Коллекция по умолчанию
Коллекция по умолчанию
Создать новую
A business growth chart displayed on a wooden table represents data analysis and strategic planning. Ideal for finance and marketing themes.
Коллекция по умолчанию
Коллекция по умолчанию
Создать новую
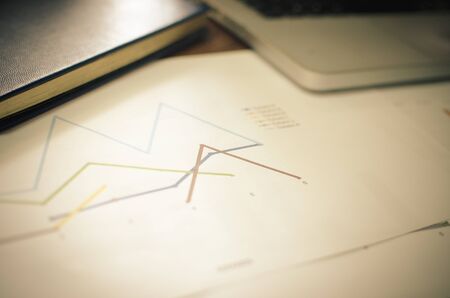
documents on office table with laptop computer and graph financial with social network diagram - Filter vintage
Коллекция по умолчанию
Коллекция по умолчанию
Создать новую

Many type of infographic diagram over white background. Top view.
Коллекция по умолчанию
Коллекция по умолчанию
Создать новую

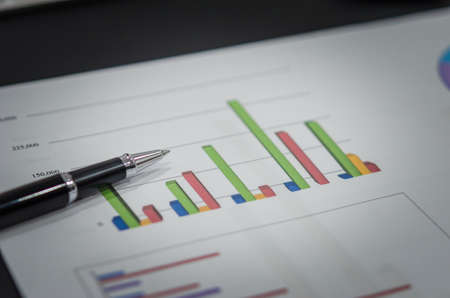
business graph with pen
Коллекция по умолчанию
Коллекция по умолчанию
Создать новую

A visually engaging workspace featuring colorful push pins and sticky notes on graph paper, illustrating data representation and enhancing creative organization for projects.
Коллекция по умолчанию
Коллекция по умолчанию
Создать новую

Graphical representation of math functions and a pencil
Коллекция по умолчанию
Коллекция по умолчанию
Создать новую

diagram pointing down. decline drop reduction concept. exponential curve on dark blue backdrop.
Коллекция по умолчанию
Коллекция по умолчанию
Создать новую
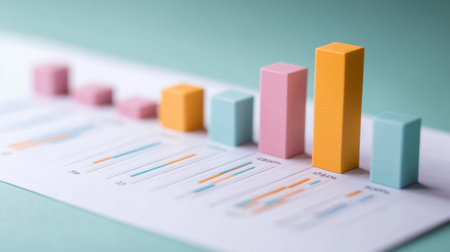
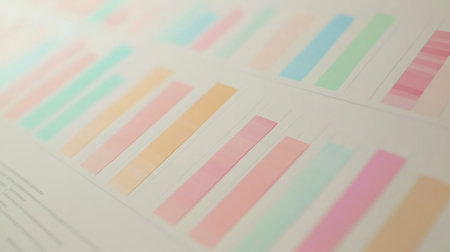
This image features a colorful bar graph on paper, showcasing pastel-colored bars that represent various data points, ideal for business and educational uses.
Коллекция по умолчанию
Коллекция по умолчанию
Создать новую

Analysis of data from graphs. select focus.
Коллекция по умолчанию
Коллекция по умолчанию
Создать новую
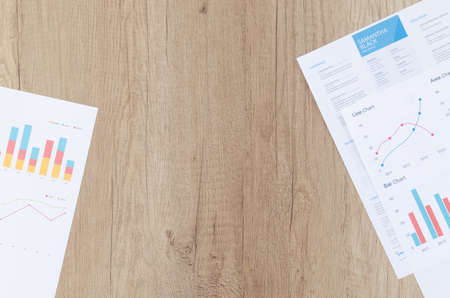
Workplace on wooden table with graph papers
Коллекция по умолчанию
Коллекция по умолчанию
Создать новую

Team work with results and reports
Коллекция по умолчанию
Коллекция по умолчанию
Создать новую
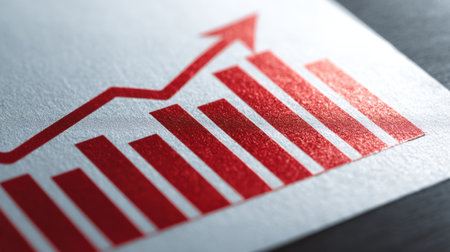
A close-up view of a red growth chart on a paper surface, symbolizing financial success and progress in business strategy and investment opportunities.
Коллекция по умолчанию
Коллекция по умолчанию
Создать новую

Blank unfolded sheet and roll of graph paper. Background for sketching, painting, drawing. Roll of blue graph paper on sheet of graph paper.
Коллекция по умолчанию
Коллекция по умолчанию
Создать новую

Concept of Q2 - 2nd Quarter Period write on sticky notes isolated on Wooden Table. stock market concept
Коллекция по умолчанию
Коллекция по умолчанию
Создать новую

business analysis and statistics concept, desk with mixed graphs and charts on notebook with magnifying glass on it
Коллекция по умолчанию
Коллекция по умолчанию
Создать новую

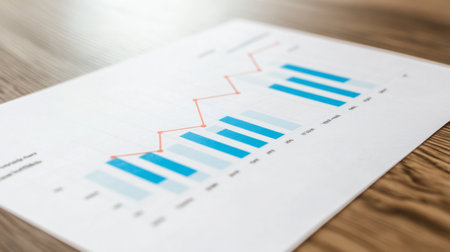
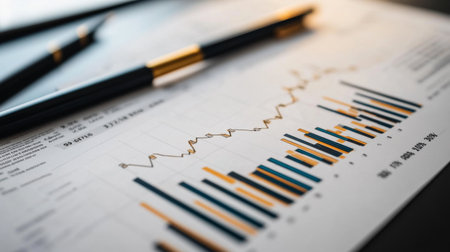
Close-up of a stock market analysis chart with a mix of bar graphs and line graphs highlighting key data
Коллекция по умолчанию
Коллекция по умолчанию
Создать новую

This image features a colorful bar graph on paper, showcasing pastel-colored bars that represent various data points, ideal for business and educational uses.
Коллекция по умолчанию
Коллекция по умолчанию
Создать новую
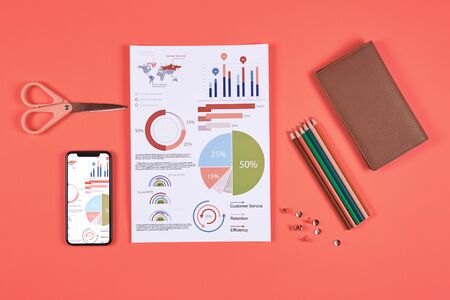
Above view flat lay of business data charts and office supplies over coral background, copy space
Коллекция по умолчанию
Коллекция по умолчанию
Создать новую

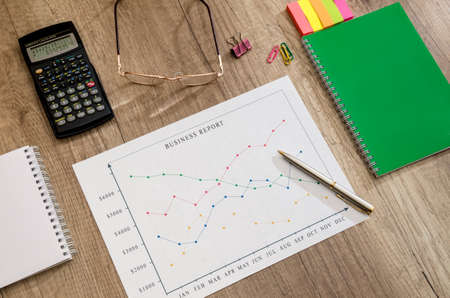
Hand of businessman looking documents report statistic financial with graph and chart and laptop computer and book on desk, finance and invest, digital marketing, business and communication concept.
Коллекция по умолчанию
Коллекция по умолчанию
Создать новую
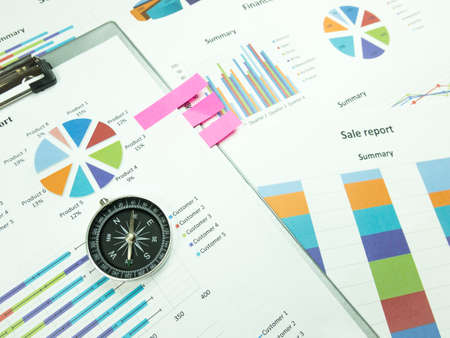
Business report chart and Financial graph analysis with compass on table.
Коллекция по умолчанию
Коллекция по умолчанию
Создать новую
Woman hand holding sales statistic diagram document
Коллекция по умолчанию
Коллекция по умолчанию
Создать новую

Businesswoman holding a notepad at her desk, a group of businessmen attending a meeting and holding meeting materials, brainstorming meeting to plan a company's growth. Business meeting idea.
Коллекция по умолчанию
Коллекция по умолчанию
Создать новую
Business document paper placed on a white scene
Коллекция по умолчанию
Коллекция по умолчанию
Создать новую
company strategy development management with graphic in business set on gray office desk background top view
Коллекция по умолчанию
Коллекция по умолчанию
Создать новую
Business woman hands analyze diagram graph show financial charts information in office table. Close up female executive explaining presenting marketing data on conference. Corporate analysis concept.
Коллекция по умолчанию
Коллекция по умолчанию
Создать новую
financial chart on the table, business concept, shallow depth of field
Коллекция по умолчанию
Коллекция по умолчанию
Создать новую
Business documents. Placed on the table with book
Коллекция по умолчанию
Коллекция по умолчанию
Создать новую
Checkered paper with torn top edge, blank blank sheet, texture and background, copy of space, template.
Коллекция по умолчанию
Коллекция по умолчанию
Создать новую

Notebook full of mathematics. Smart phone, pencils and crumpled paper are visible
Коллекция по умолчанию
Коллекция по умолчанию
Создать новую

Charts Graphs paper. Financial development, Banking Account, Statistics, Investment Analytic research data economy, Stock exchange Business office company meeting concept.
Коллекция по умолчанию
Коллекция по умолчанию
Создать новую
Workplace on wooden table with graph papers
Коллекция по умолчанию
Коллекция по умолчанию
Создать новую

Annual business report. Accountability paperwork. Hands holding a heap of documents with graphs and statistics
Коллекция по умолчанию
Коллекция по умолчанию
Создать новую
A vibrant display of pastel color swatches arranged on a light background, ideal for exploring color combinations and creative design concepts. Perfect for artists and designers.
Коллекция по умолчанию
Коллекция по умолчанию
Создать новую
Business reports
Коллекция по умолчанию
Коллекция по умолчанию
Создать новую

Blank unfolded sheet and roll of graph paper. Background for sketching, painting, drawing. Roll of blue graph paper on sheet of graph paper.
Коллекция по умолчанию
Коллекция по умолчанию
Создать новую
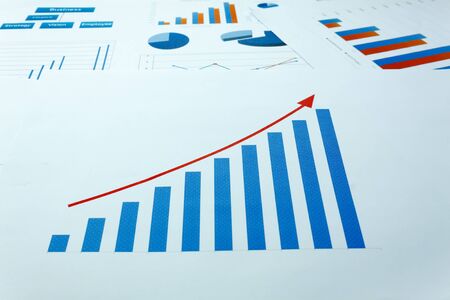
Close-up of a business chart showing a rising trend line, symbolizing growth and progress in financial performance. Ideal for economic insights.
Коллекция по умолчанию
Коллекция по умолчанию
Создать новую
Clean desk setup for strategic planning with annual growth projection
Коллекция по умолчанию
Коллекция по умолчанию
Создать новую
Analytic chart element, colorful infographics. Business statistic, diagram, data visualization, graph information.
Коллекция по умолчанию
Коллекция по умолчанию
Создать новую
Graphs
Коллекция по умолчанию
Коллекция по умолчанию
Создать новую
Printed graphs and laptop on dark gray surface
Коллекция по умолчанию
Коллекция по умолчанию
Создать новую

business analysis and statistics concept, desk with mixed graphs and charts on clipboard
Коллекция по умолчанию
Коллекция по умолчанию
Создать новую
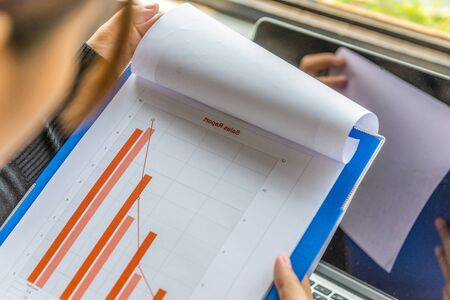
Sales report document showing upward trend line and positive revenue projections
Коллекция по умолчанию
Коллекция по умолчанию
Создать новую
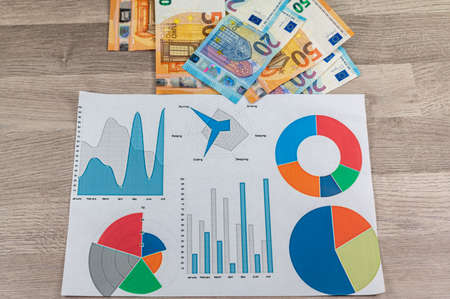
20 and 50 euro banknotes and wallet and cigar on wood background
Коллекция по умолчанию
Коллекция по умолчанию
Создать новую
Financial paper charts and graphs on the table
Коллекция по умолчанию
Коллекция по умолчанию
Создать новую
business background grown up concept the business chart document background.
Коллекция по умолчанию
Коллекция по умолчанию
Создать новую
Financial paper with charts and diagrams on gray table
Коллекция по умолчанию
Коллекция по умолчанию
Создать новую
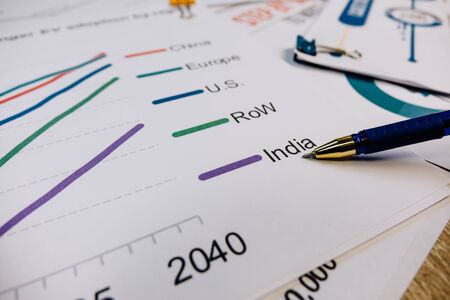
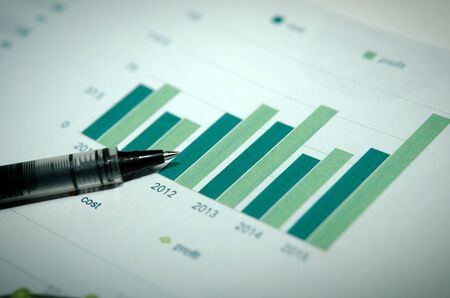
the pen points to the chart layer with the word India.
Коллекция по умолчанию
Коллекция по умолчанию
Создать новую
Financial accounting stock market graphs analysis.Filter vintage
Коллекция по умолчанию
Коллекция по умолчанию
Создать новую
The workplace of a businessman
Коллекция по умолчанию
Коллекция по умолчанию
Создать новую
financial charts and graphs on the table of the businessman, business concept
Коллекция по умолчанию
Коллекция по умолчанию
Создать новую
Business paperwork present with diagram.
Коллекция по умолчанию
Коллекция по умолчанию
Создать новую
Stock Chart Macro Concept Bright
Коллекция по умолчанию
Коллекция по умолчанию
Создать новую
working economist financial analytics papers
Коллекция по умолчанию
Коллекция по умолчанию
Создать новую
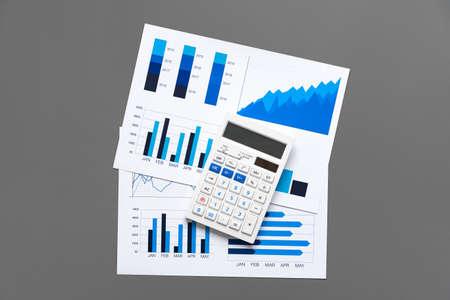
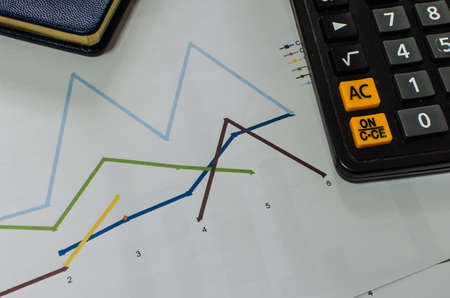
business concept - graphs, calculator, money and pen on desk
Коллекция по умолчанию
Коллекция по умолчанию
Создать новую

financial graph
Коллекция по умолчанию
Коллекция по умолчанию
Создать новую
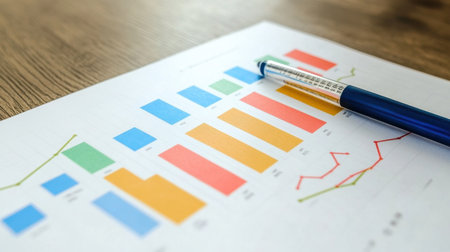
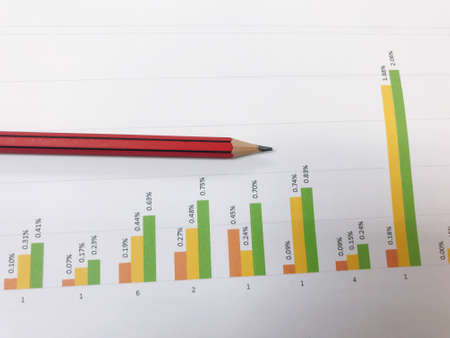
A vibrant bar chart showcases analytical data on a business report, accompanied by a pen on a wooden tabletop, ideal for professional and financial presentations.
Коллекция по умолчанию
Коллекция по умолчанию
Создать новую
Red growth arrow on blue background. Arrow graph going up. The economic growth
Коллекция по умолчанию
Коллекция по умолчанию
Создать новую
graph paper showing business information, Business graph analysis concept
Коллекция по умолчанию
Коллекция по умолчанию
Создать новую
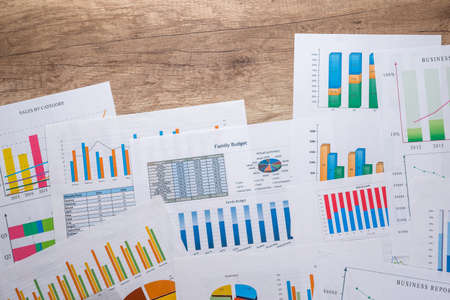
Detailed graphs and charts displayed on paper capture vital business metrics and analysis, showcasing data-driven insights for strategic planning and informed decision-making.
Коллекция по умолчанию
Коллекция по умолчанию
Создать новую

business analysis and statistics concept, desk with mixed graphs and charts on notebook with magnifying glass on it
Коллекция по умолчанию
Коллекция по умолчанию
Создать новую
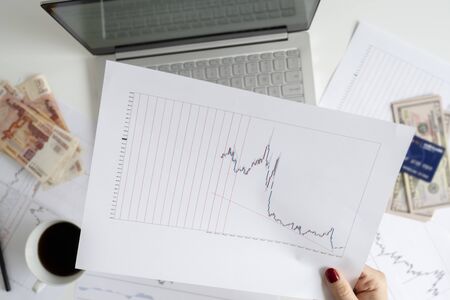
Woman freelancer. pack of banknotes fifty U.S. dollars, five thousand rubles, credit card and laptop with graphics and charts on office table. Forex exchange concept, Flat lay.
Коллекция по умолчанию
Коллекция по умолчанию
Создать новую
An AI generated illustration of project management graphs charts paper
Коллекция по умолчанию
Коллекция по умолчанию
Создать новую
Business graph and chart finance, accounting, statistics and analytic research with pen .Business document concept
Коллекция по умолчанию
Коллекция по умолчанию
Создать новую
graph paper showing business information, Business graph analysis concept
Коллекция по умолчанию
Коллекция по умолчанию
Создать новую
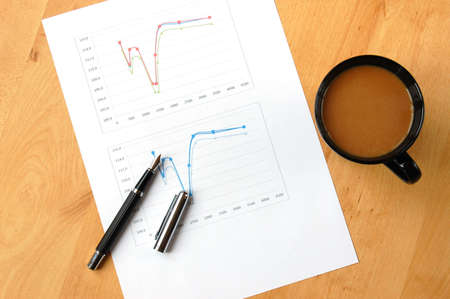
business still life with coffee and chart showing success
Коллекция по умолчанию
Коллекция по умолчанию
Создать новую

top view of financial chart display on smart phone on table
Коллекция по умолчанию
Коллекция по умолчанию
Создать новую

Business concept: pen and finance report over white
Коллекция по умолчанию
Коллекция по умолчанию
Создать новую
A close-up of a printed gold price chart with annotations and trend lines, placed on a desk with financial reports and a pen, emphasizing detailed market analysis.
Коллекция по умолчанию
Коллекция по умолчанию
Создать новую
Financial graphs analysis and pen.
Коллекция по умолчанию
Коллекция по умолчанию
Создать новую
Businessman hand holding a document. Scenes white background.
Коллекция по умолчанию
Коллекция по умолчанию
Создать новую
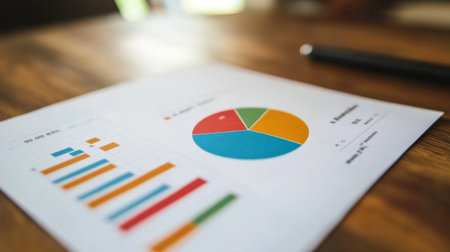
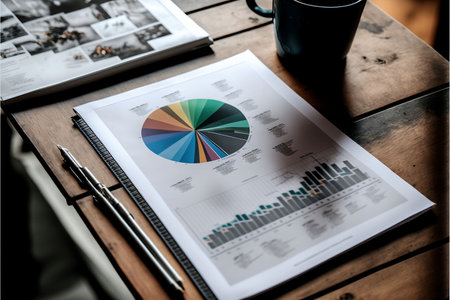
A close-up view of business analysis documents showcasing colorful graphs and charts on a wooden table, symbolizing data studies and insights.
Коллекция по умолчанию
Коллекция по умолчанию
Создать новую
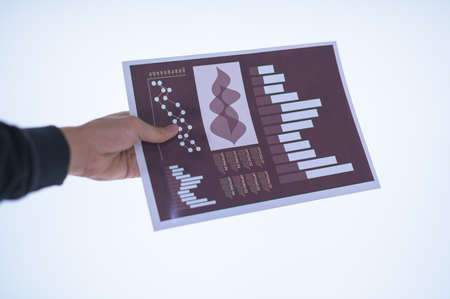
A vibrant collection of data visualization elements including colorful charts and graphs arranged on a dark surface, ideal for business analysis and presentation needs.
Коллекция по умолчанию
Коллекция по умолчанию
Создать новую
Growing chart on A4 page on blue background
Коллекция по умолчанию
Коллекция по умолчанию
Создать новую

Background of business graph
Коллекция по умолчанию
Коллекция по умолчанию
Создать новую
A close-up of a financial report with multiple bar charts and performance metrics, emphasizing detailed data analysis and business insights on a clean white desk.
Коллекция по умолчанию
Коллекция по умолчанию
Создать новую

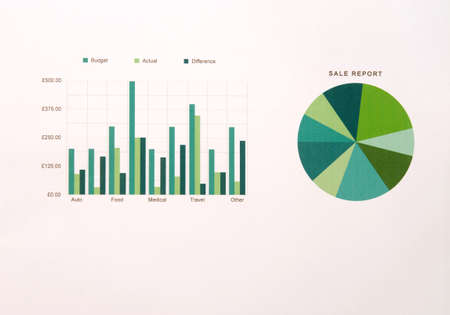
Close-up photo of sale statistic report document at office table
Коллекция по умолчанию
Коллекция по умолчанию
Создать новую
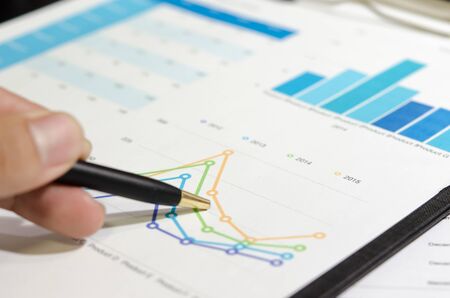
Chart and pen on the desk.
Коллекция по умолчанию
Коллекция по умолчанию
Создать новую

business analysis and statistics concept, desk with mixed graphs and charts on clipboard
Коллекция по умолчанию
Коллекция по умолчанию
Создать новую
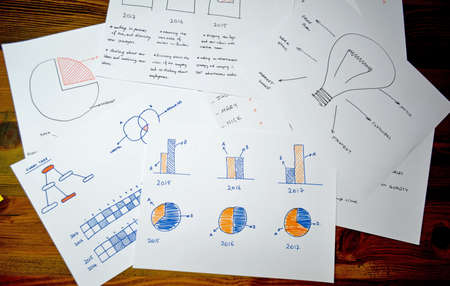
Three sheets of paper with drawings and graphs signed with text on a black background.
Коллекция по умолчанию
Коллекция по умолчанию
Создать новую
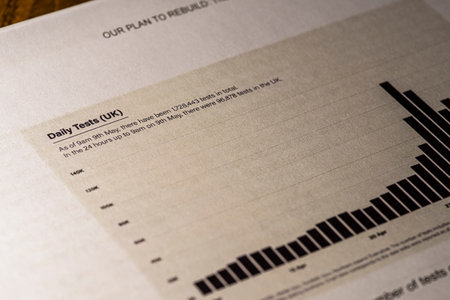
London, UK - May 11th 2020: Daily Tests heading in the document Our Plan To Rebuild - the UK Governments COVID-19 recovery strategy.
Коллекция по умолчанию
Коллекция по умолчанию
Создать новую
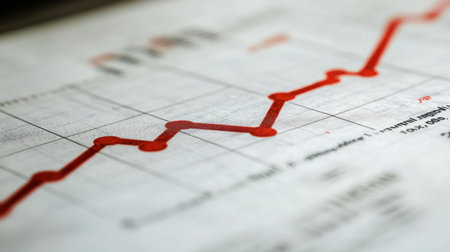
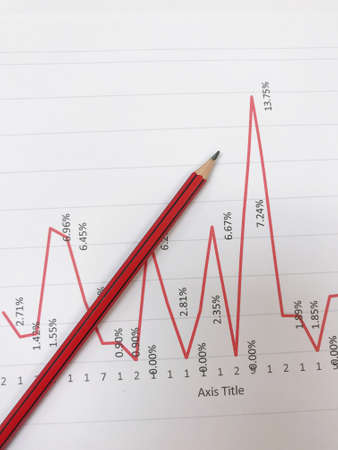
A close-up of a line graph showing fluctuating trends, used to analyze market behavior or performance over time.
Коллекция по умолчанию
Коллекция по умолчанию
Создать новую
Black pen on paper, colorful graphs at work.
Коллекция по умолчанию
Коллекция по умолчанию
Создать новую
reports
Коллекция по умолчанию
Коллекция по умолчанию
Создать новую

Financial report and laptop on business desk
Коллекция по умолчанию
Коллекция по умолчанию
Создать новую
financial report with pen and calculator at the office
Коллекция по умолчанию
Коллекция по умолчанию
Создать новую

Business plan documents and charts for eco-tourism startup on rustic wooden table
Коллекция по умолчанию
Коллекция по умолчанию
Создать новую
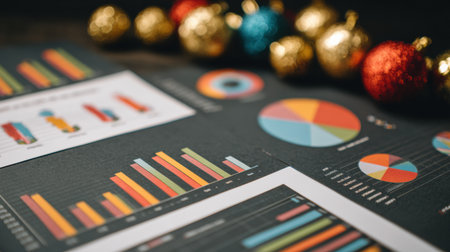
Charts and graphs display data insights on a table, while vibrant holiday ornaments add a festive touch to the workspace, creating a cheerful atmosphere.
Коллекция по умолчанию
Коллекция по умолчанию
Создать новую
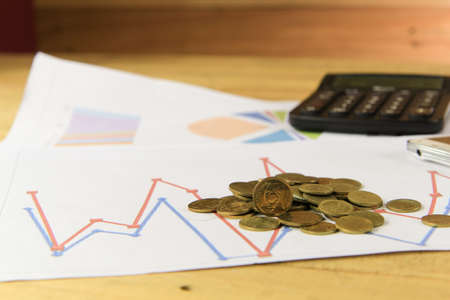
Gold coins on finance graph report and blacak calculator
Коллекция по умолчанию
Коллекция по умолчанию
Создать новую
many different business graph with calculator and pen on desk.
Коллекция по умолчанию
Коллекция по умолчанию
Создать новую
Legion-Media
Создайте свои проекты на основе качественных стоковых фотографий и видео.


Copyright © Legion-Media.